SLURM cluster with auto generated Dashboards
As promised in my last post here's a blog post about the QNIBTerminal powered SLURM stack with auto generated dashboards. I started writing it two weeks ago, embarrassing - sorry for the delay. As a reminder I'll keep the date.
The stack looks like this:
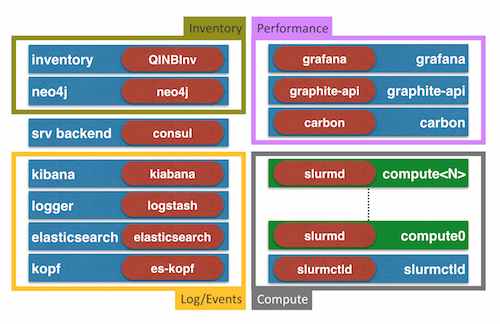
For those following my blog most of the stack should look familiar.
- service backend powered by
consulto provide a DNS interface that is updated dynamically and provides a Key/Value store, health check and all the fun (an introduction could be found here). - the ELK based log-engine using elastic search as a backend, logstash to process the log events and kibana (v3) to show it off
- a metrics framework rooted within the graphite universe using carbon as a backend, graphite-api to provide the API and grafana as a frontend
- some compute containers which are able to run MPI and script workloads including a SLURM setup
New to the mix is the Inventory piece which provides a graph database in the form of neo4j and a daemon which interfaces with neo4j.
Spinning up the Stack
To spin up the stack a docker server is needed and a fairly good internet connection (can be compensated if you give it time :).
$ mkdir dckr-slurm; cd dckr-slurm
$ curl -Ls https://raw.githubusercontent.com/ChristianKniep/orchestra/master/qnibterminal/docker-compose.yml
$ docker-compose pull
*snip*
$ docker-compose up -d
Creating qnibterminal_consul_1...
Creating qnibterminal_carbon_1...
Creating qnibterminal_gapi_1...
*snip*
Once you are in the up part you can head to your browser and point it to the consul UI, which is served on port 8500.
It will provide you an overview on how are the services within the stack are doing and once everything is green you are good to go.
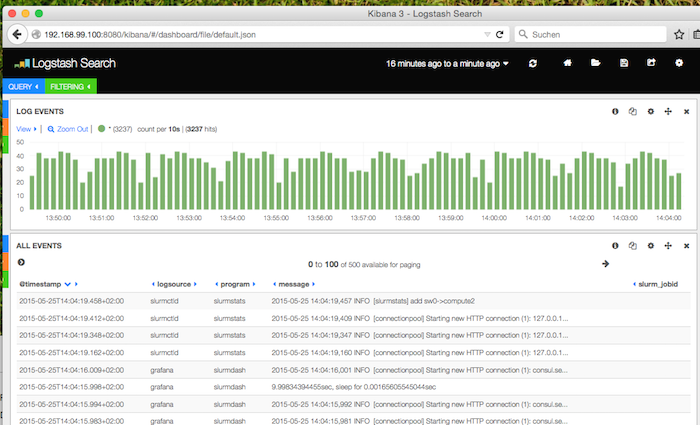
Kibana
Pointed to :8080/kibana the kibana dashboard is served, which given an overview about the log activity.
Performance
The performance dashboard is available through /grafana/:

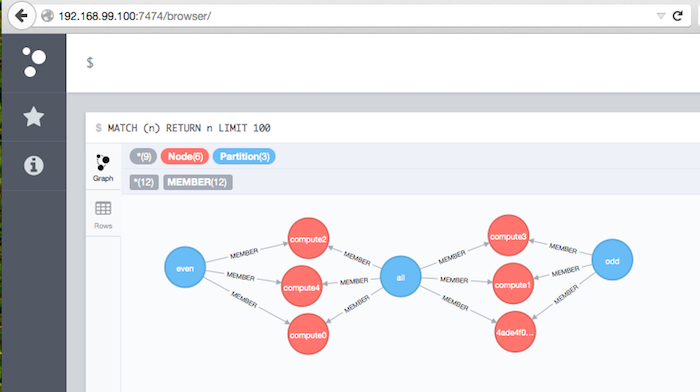
Node Inventory
So far the Inventory is populated with the SLURM partitions (:7474):
Slurm Jobs
But that is all only noise in the system, the interesting bit is to create dynamic dashboards.
Start Jobs
By putting a new process into the first compute node, we are 'logging' into the node. By looking around, we find all the usual SLURM tools.
[host] $ docker exec -ti dckrslurm_compute0_1 bash
[root@compute0 /]# sinfo
PARTITION AVAIL  TIMELIMIT  NODES  STATE NODELIST
all*         up   infinite      6   idle 4ade4f009a4a,compute[0-4]
odd          up   infinite      3   idle 4ade4f009a4a,compute[1,3]
even         up   infinite      3   idle compute[0,2,4]
[root@compute0 /]# scontrol show partition
PartitionName=all
   AllowGroups=ALL AllowAccounts=ALL AllowQos=ALL
   AllocNodes=ALL Default=YES QoS=N/A
   DefaultTime=NONE DisableRootJobs=NO ExclusiveUser=NO GraceTime=0 Hidden=NO
   MaxNodes=UNLIMITED MaxTime=UNLIMITED MinNodes=1 LLN=NO MaxCPUsPerNode=UNLIMITED
   Nodes=4ade4f009a4a,compute0,compute1,compute2,compute3,compute4
*snip*
A little helper script issues some work to be done.
[root@compute0 /]# /opt/qnib/bin/generate_work.sh 10 3 compute2
>> su -l -c 'sbatch -N4 /opt/qnib/jobscripts/gemm.sh 50 65536 compute2' john
Submitted batch job 2
>> su -l -c 'sbatch -N2 /opt/qnib/jobscripts/gemm.sh 250 32768 compute2' john
Submitted batch job 3
>> su -l -c 'sbatch -N4 /opt/qnib/jobscripts/gemm.sh 250 65536 compute2' alice
Submitted batch job 4
>> su -l -c 'sbatch -N4 /opt/qnib/jobscripts/gemm.sh 500 65536 compute2' dave
Submitted batch job 5
>> su -l -c 'sbatch -N3 /opt/qnib/jobscripts/ping_pong.sh compute2' carol
Submitted batch job 6
>> su -l -c 'sbatch -N4 /opt/qnib/jobscripts/gemm.sh 500 32768 compute2' bob
Submitted batch job 7
>> su -l -c 'sbatch -N3 /opt/qnib/jobscripts/ping_pong.sh compute2' alice
Submitted batch job 8
>> su -l -c 'sbatch -N2 /opt/qnib/jobscripts/ping_pong.sh compute2' john
Submitted batch job 9
>> su -l -c 'sbatch -N2 /opt/qnib/jobscripts/gemm.sh 500 65536 compute2' john
Submitted batch job 10
>> su -l -c 'sbatch -N4 /opt/qnib/jobscripts/gemm.sh 50 32768 compute2' bob
Submitted batch job 11
This script spins up 10 jobs with a maximum node count of 3.
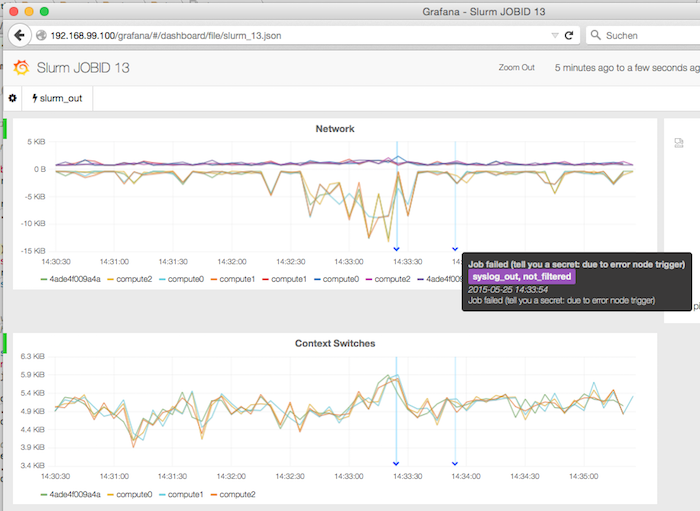
Slurm Dashboard
A dashboards with griffin shows the activity:
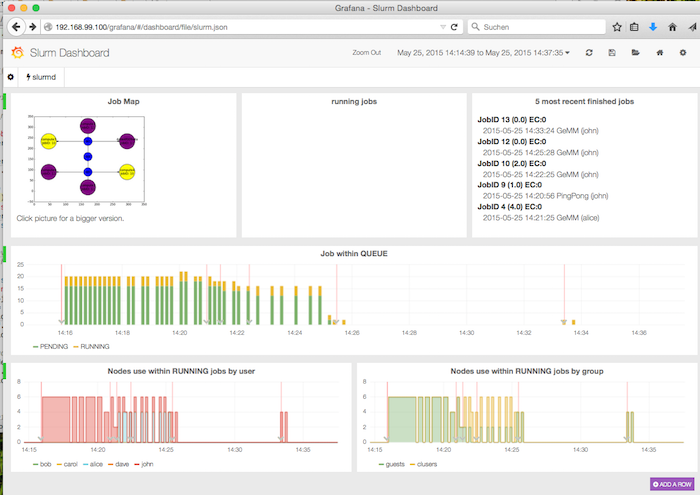
By clicking on one of the jobs, a more detailed view comes to light. In the following case, the job has FAILED (because I wanted him to :).
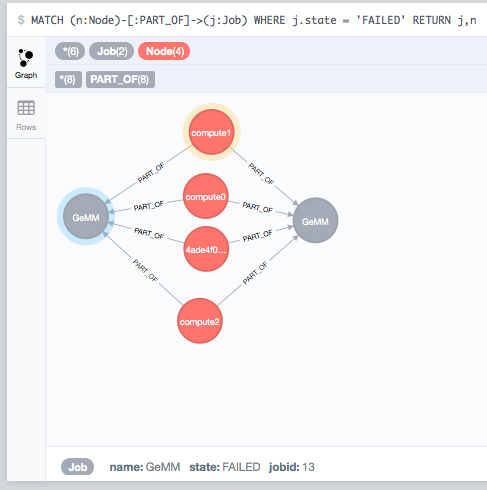
Job Inventory
The job states are represented in the inventory:
That should conclude the quick walkthrough. If you have questions, just drop me a note on twitter or send an email.