Locafox Ops Stack 101: The Foundation
Note
This post first appeared at the Locafox tech Blog, which is not reachable anymore.
At Locafox we are aiming to rule the world, at least the local-commerce part of the internet. For that we need a solid foundation that enables our developers and operational staff (some say DevOps) to do awesome stuff.
Our current infrastructure is hosted on Amazon EC2 using a custom golang-tool that helps us herd the cloud, bootstrap the instances, configure them according to our needs and update the platform's stack. All of it with one single binary that abstracts the pain without a dependency hell attached.
Now that we are heading towards launch day we are consolidating our infrastructure to keep pandoras cloud-box closed.
This post is going to kickstart a little series about how we do things by explaining the 'to-be' corner stone of our operations infrastructure, consul.
Lose ends
We want our infrastructure to be robust and self-governing (to an extent). External dependencies should be reduced as much as possible and our dream would be to be free from the underlying platform. Our toolbox abstracts the hassle of provisioning Amazon EC2 instances with all the interconnected topics like profiles and security group. As for all StartUps our infrastructure grew organically and now that we are dealing with a bigger team and a scale out ahead of us we are looking into ways of consolidating and orchestrating the services spread throughout the cluster. Since we are adapting
In particular solving dependencies and share a common configuration is something that cries for an elegant solution.
Consul FTW
Consul, a golang daemon developed by HashiCorp, provides basic services to help running a distributed systems:
- distributed architecture For starters consul is distributed itself. It uses a protocol based on raft to elect a leader and the gossip protocol to distribute messages in a effective manner.
- services If a host provides an http server, consul could be used to propagate this service to others and alarms if it's down (like a Nagios check). Best of it: If the alarm is triggered, the service is not propagated anymore.
- DNS Consul provides a DNS interface which exposes the information in real-time. This includes IP address resolution as well as SRV records (love this!). The DNS interface is exposed on each server, just query
localhostand you are good to go. - Key/Value Store Consul also includes a key/value store like etcd which is replicated throughout the cluster.
- ACL All of this could be protected with AccessControlList.
- events/triggers/run Beside the service functionalities above consul could be used to send messages and trigger scripts when a given event is fired. That's for another day to explore.
OK, the outline is made. Let's dive in a little bit deeper. First I would like to outline the goal behind this.
Holy Grail
For now we are refining our stack and with every iteration we are getting closer to it.
DNS
Instead of hardwired IP addresses we instead narrowing in to use consul's DNS service. OK, we could do this using route53 or some other external service, but in order to do so we have to keep up everything in sync; an external dependency we avoid by using consul's DNS interface.
Service Checks with Dashboard
There should be a simple UI (and an API) to figure out what is going on. Consul has a nice and simple dashboard to help us out with that. Every host has local configuration that defines services to be propagated and checked.
Event based configuration
Currently the configuration is to some extent distributed. Some is hand-crafted, some is hardwired, dynamic, semi-dynamic. Wouldn't it be nice if the cluster kind of holds and updates itself automatically? Let's assume we kill the monitoring sink container and a new one is born. Currently we have to provision new configuration to all nodes. But how lame is that? If every node is part of the consul cluster they could discover them-self the events:
- monitoring box down Deconfigure monitoring and set timeout to expect a new box
- monitoring box up Reconfigure monitoring and keep an eye on it for a couple of minutes.
By doing the configuration event based the automation could get into gear and all items are testable.
Consul 101
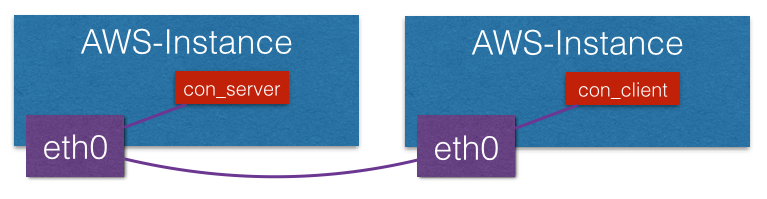
Our monitoring instance is running a consul agent in server mode. The other boxes will connect to the server and from then on they are part of the cluster.
Consul's web guy looks like this.
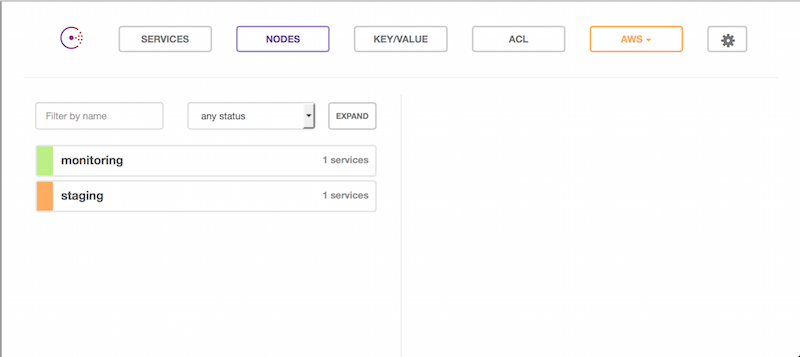
The services running on the host are exposed by describing them within tiny json config files.
$ cat /etc/consul.d/check_elasticsearch.json
{
  "service": {
    "name": "elasticsearch",
    "port": 9200,
    "check": {
      "script": "curl -s http://127.0.0.1:9200",
      "interval": "10s"
    }
  }
}
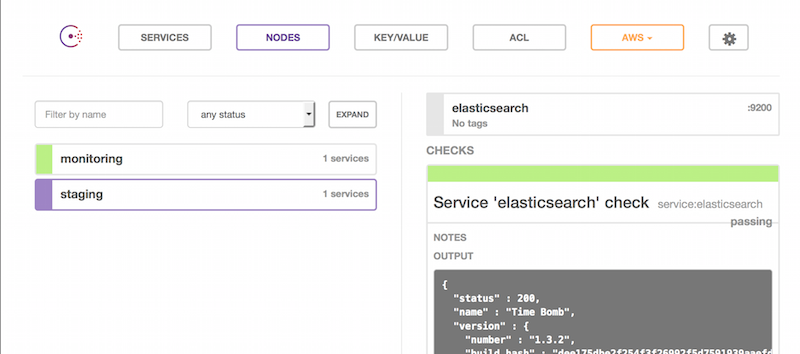
This config file will expose the service elasticsearch via DNS and it will check the service every 10s.
Let's have a look at the GUI again.
By setting this up, we now can discover the service through the DNS interface:
$ dig @127.0.0.1 elasticsearch.service.consul SRV

; <<>> DiG 9.9.5-3ubuntu0.1-Ubuntu <<>> @127.0.0.1 elasticsearch.service.consul SRV
; (1 server found)
;; global options: +cmd
;; Got answer:
;; ->>HEADER<<- opcode: QUERY, status: NOERROR, id: 48535
;; flags: qr aa rd; QUERY: 1, ANSWER: 1, AUTHORITY: 0, ADDITIONAL: 1
;; WARNING: recursion requested but not available

;; QUESTION SECTION:
;elasticsearch.service.consul.  IN  SRV

;; ANSWER SECTION:
elasticsearch.service.consul. 0 IN  SRV 1 1 9200 staging.node.aws.consul.

;; ADDITIONAL SECTION:
staging.node.aws.consul. 0  IN  A   172.31.0.9

;; Query time: 0 msec
;; SERVER: 127.0.0.1#53(127.0.0.1)
;; WHEN: Thu Jan 29 11:06:10 UTC 2015
;; MSG SIZE  rcvd: 156
The checks are helping us out to figure out if a service is up'n'running or not. When it's not the service won't be exposed anymore.
If I stop the service (service elastic search stop), the check will return a non-zero error code and the SRV entry disappears:
$ dig @127.0.0.1 elasticsearch.service.consul SRV

; <<>> DiG 9.9.5-3ubuntu0.1-Ubuntu <<>> @127.0.0.1 elasticsearch.service.consul SRV
; (1 server found)
;; global options: +cmd
;; Got answer:
;; ->>HEADER<<- opcode: QUERY, status: NOERROR, id: 17997
;; flags: qr aa rd; QUERY: 1, ANSWER: 0, AUTHORITY: 0, ADDITIONAL: 0
;; WARNING: recursion requested but not available

;; QUESTION SECTION:
;elasticsearch.service.consul.  IN  SRV

;; Query time: 0 msec
;; SERVER: 127.0.0.1#53(127.0.0.1)
;; WHEN: Thu Jan 29 11:05:19 UTC 2015
;; MSG SIZE  rcvd: 46
That should conclude the first post about the basics. And I haven't even touched the Key/Value store or how we use multiple datacenter within consul to abstract Docker containers running on-top of the monitoring host.
Not to mention our log- and performance monitoring infrastructure... There is a lot to talk about. Stay tuned!
Cheers